dsh-all-usage
在终端中运行以下命令:
dsh plugin install ParticleLight/dsh-all-usage
将以下提示词粘贴到 DeepSeek Harness 对话框中:
在 DeepSeek Harness 中执行 dsh plugin install ParticleLight/dsh-all-usage 即可安装,插件源码见 https://github.com/ParticleLight/dsh-all-usage
插件介绍
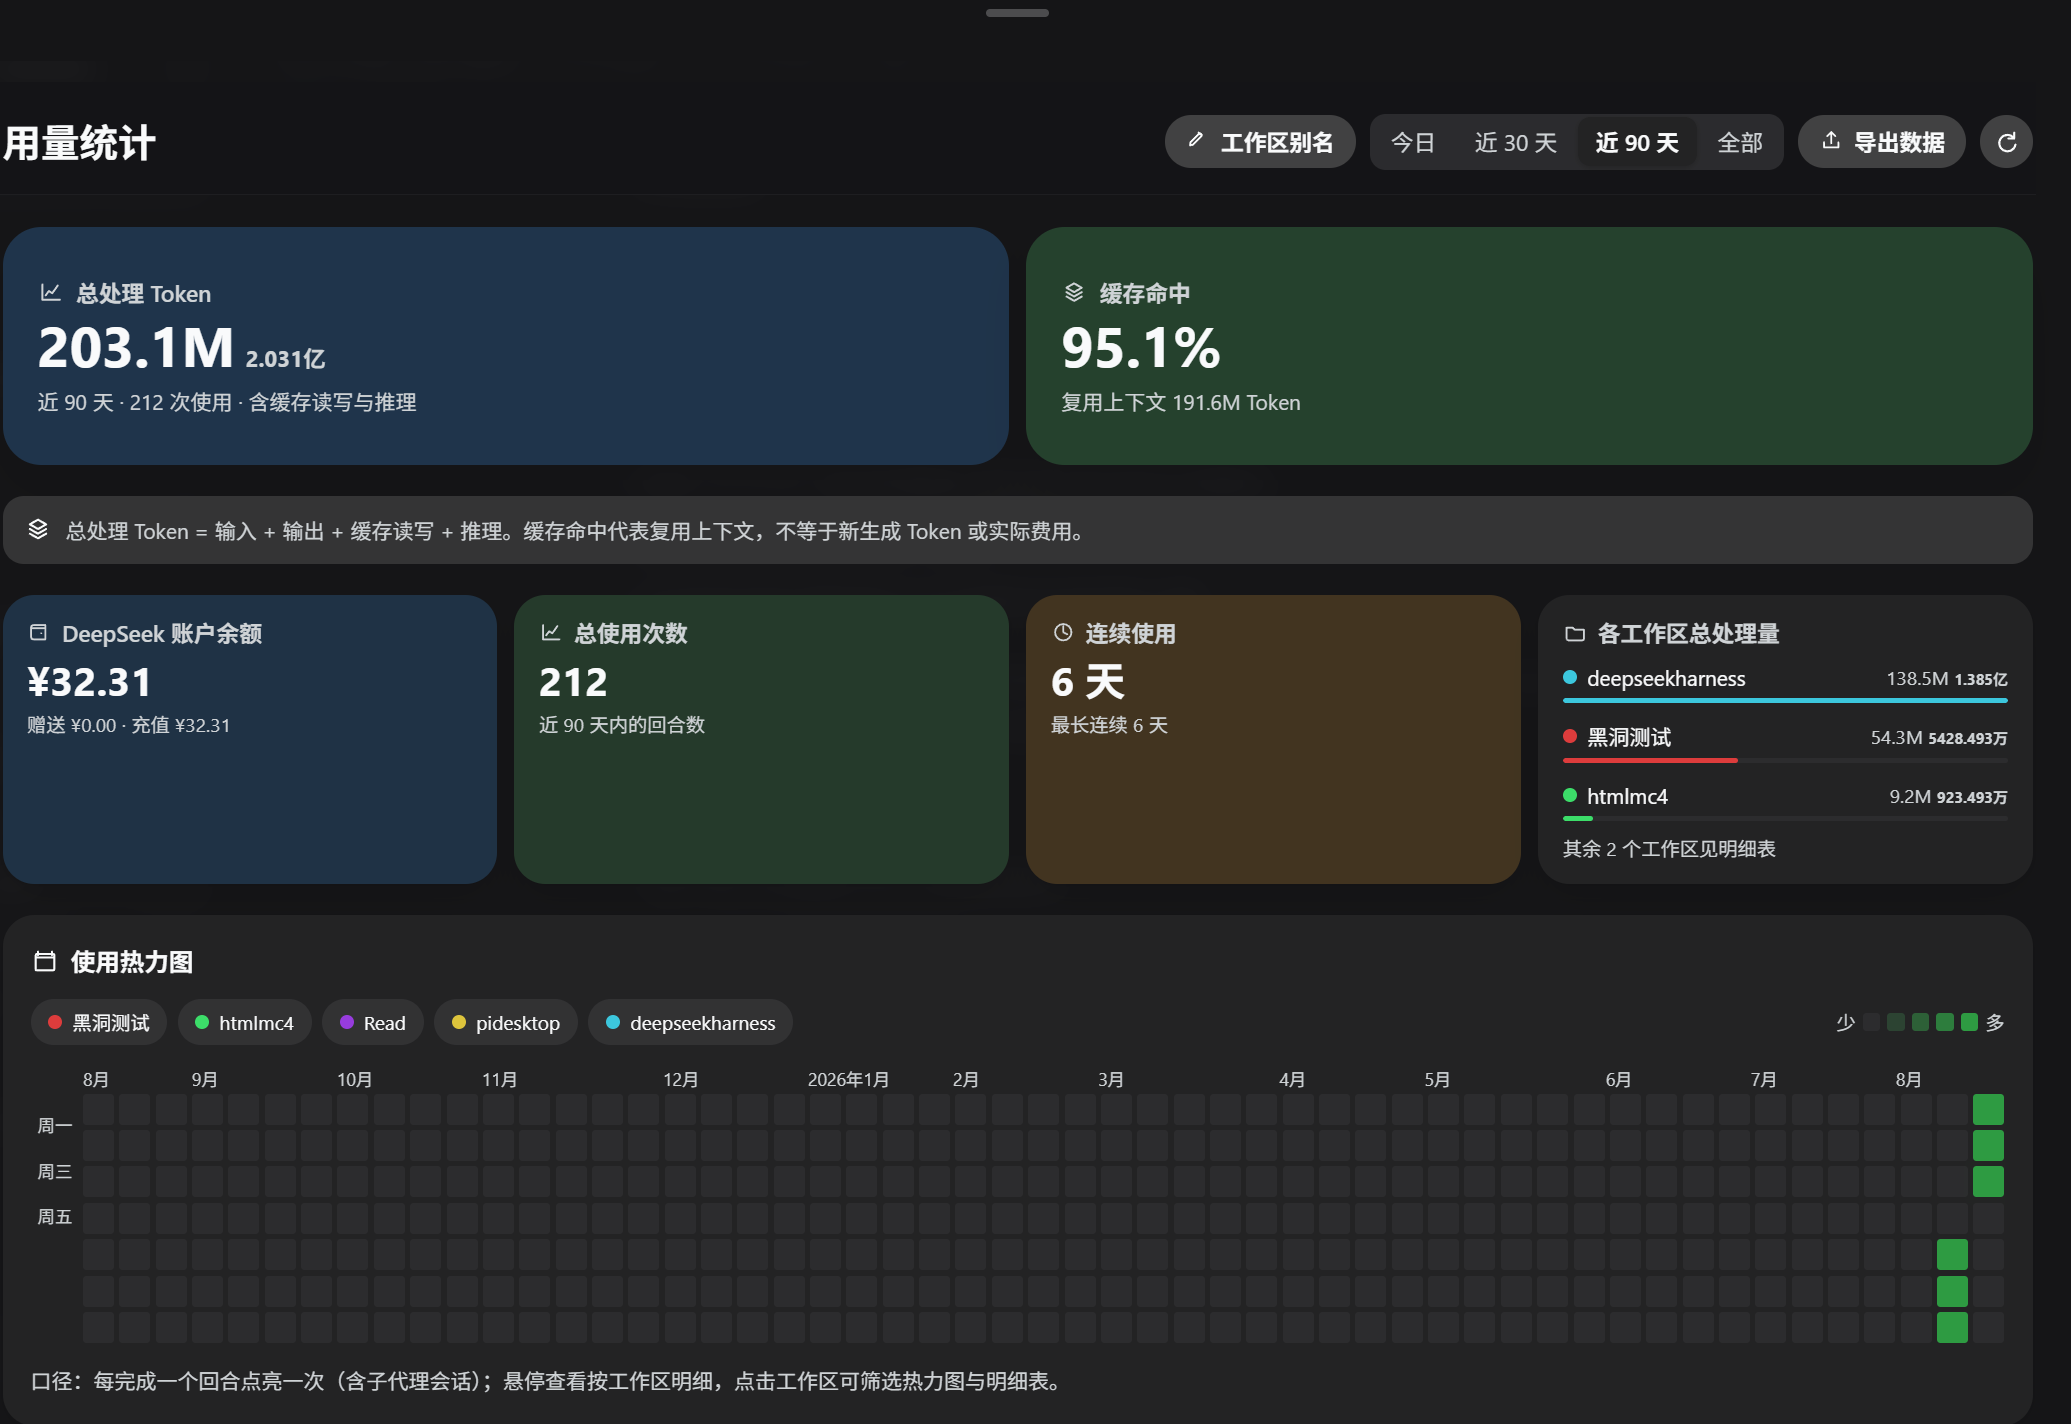
After a few months on DeepSeek Harness, you have probably hit the same wall: you want to know how many tokens you actually burned, whether the cache is doing any real work, and which workspace or model drives the spend, but the answers are buried in scattered session logs. dsh-all-usage turns that digging into a single sidebar dashboard you can open and read.
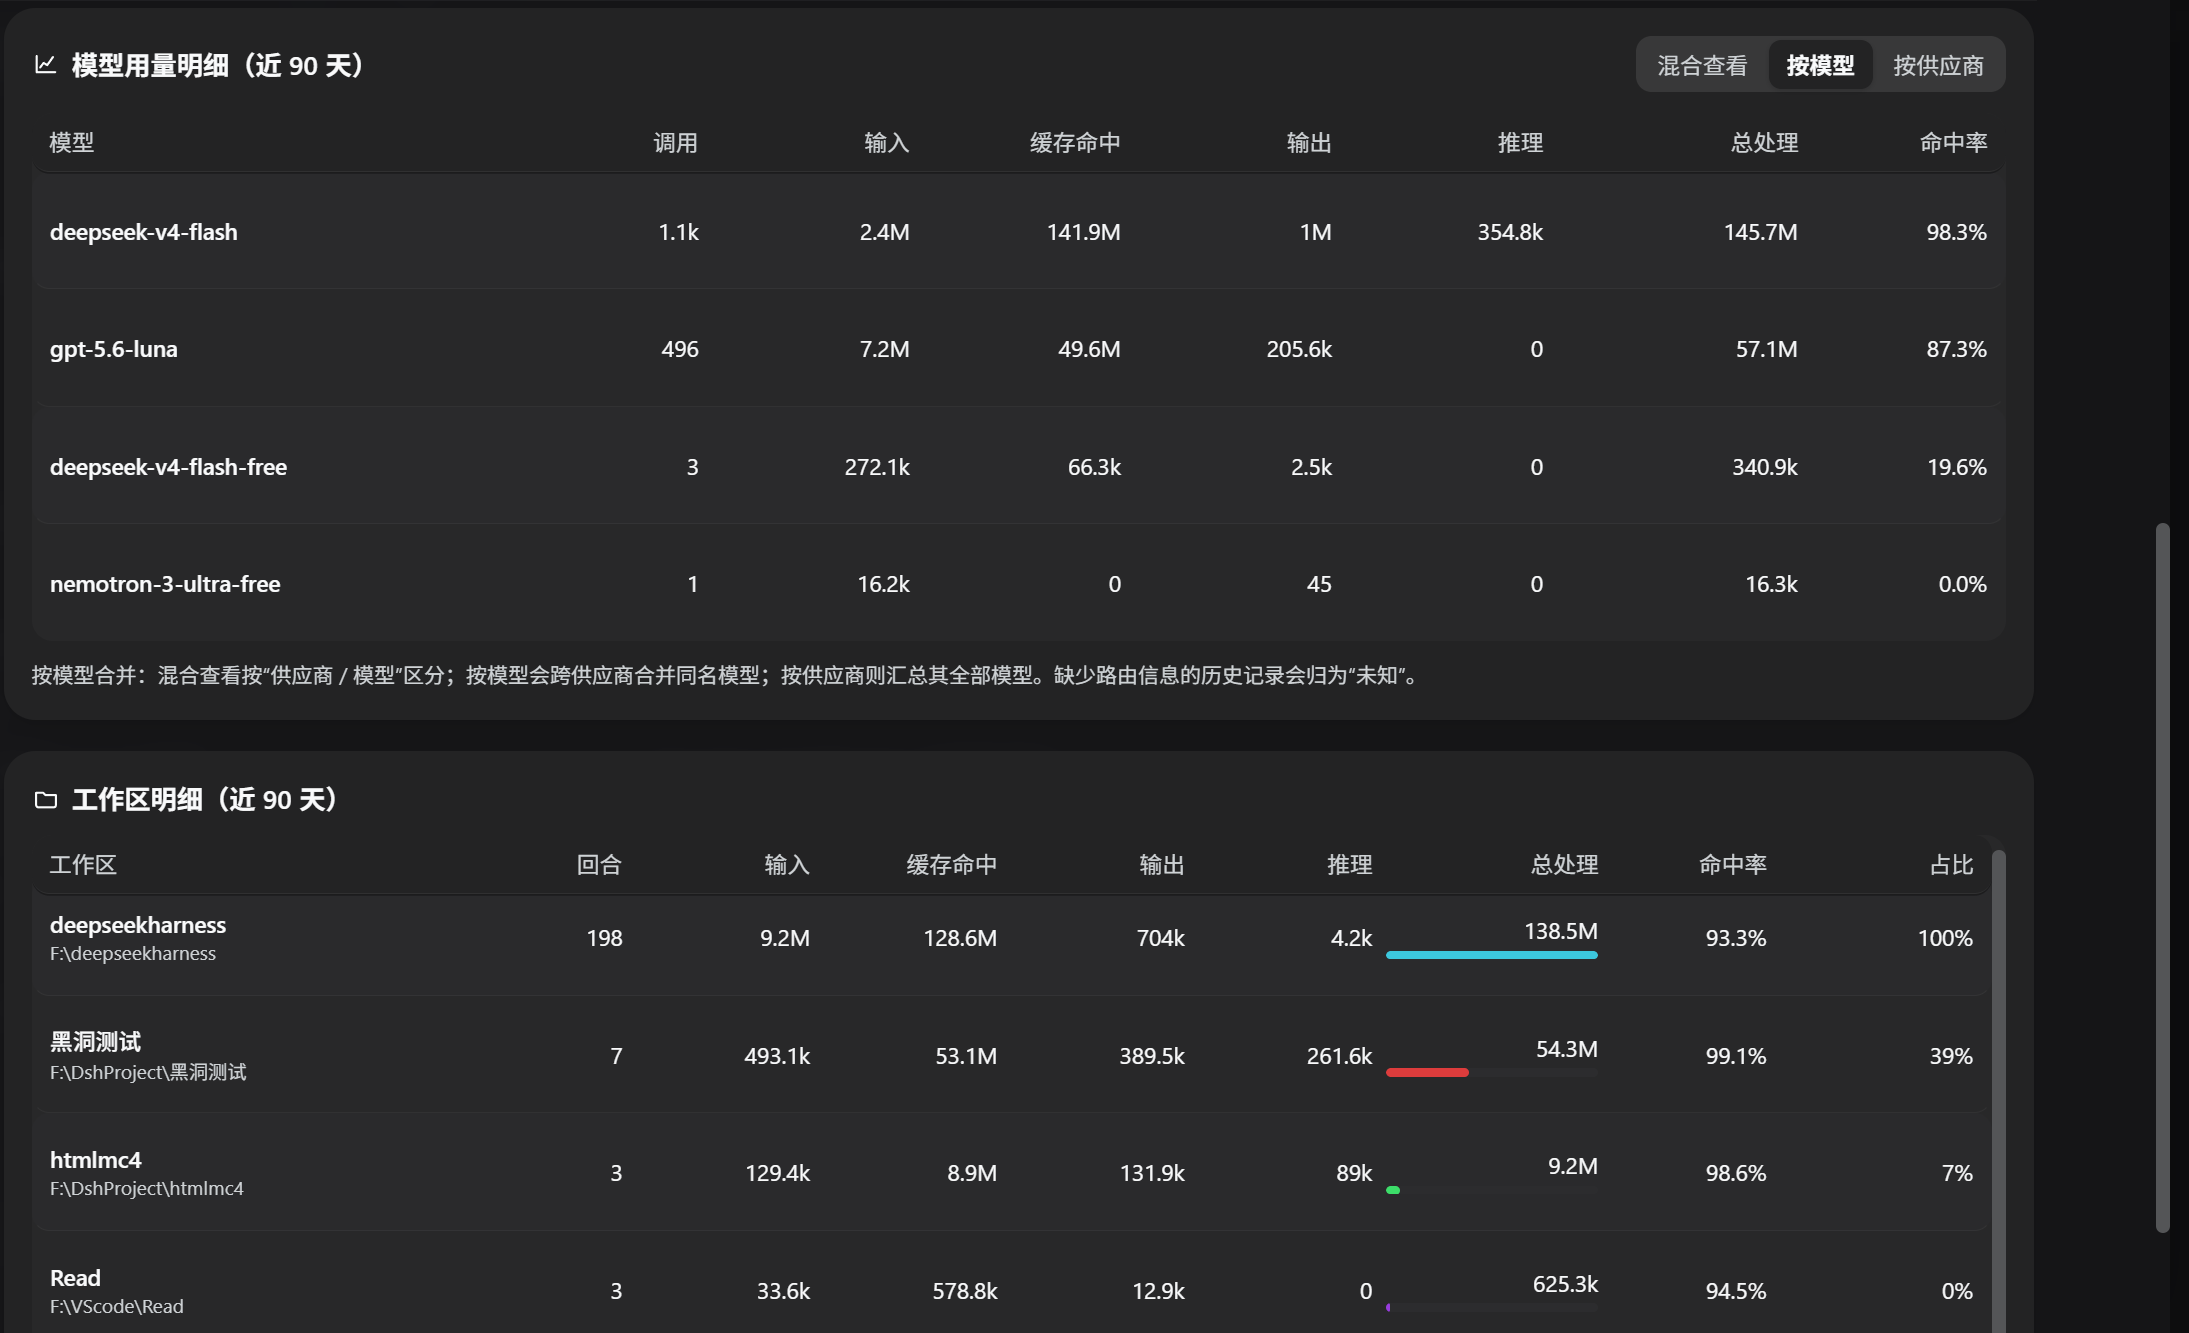
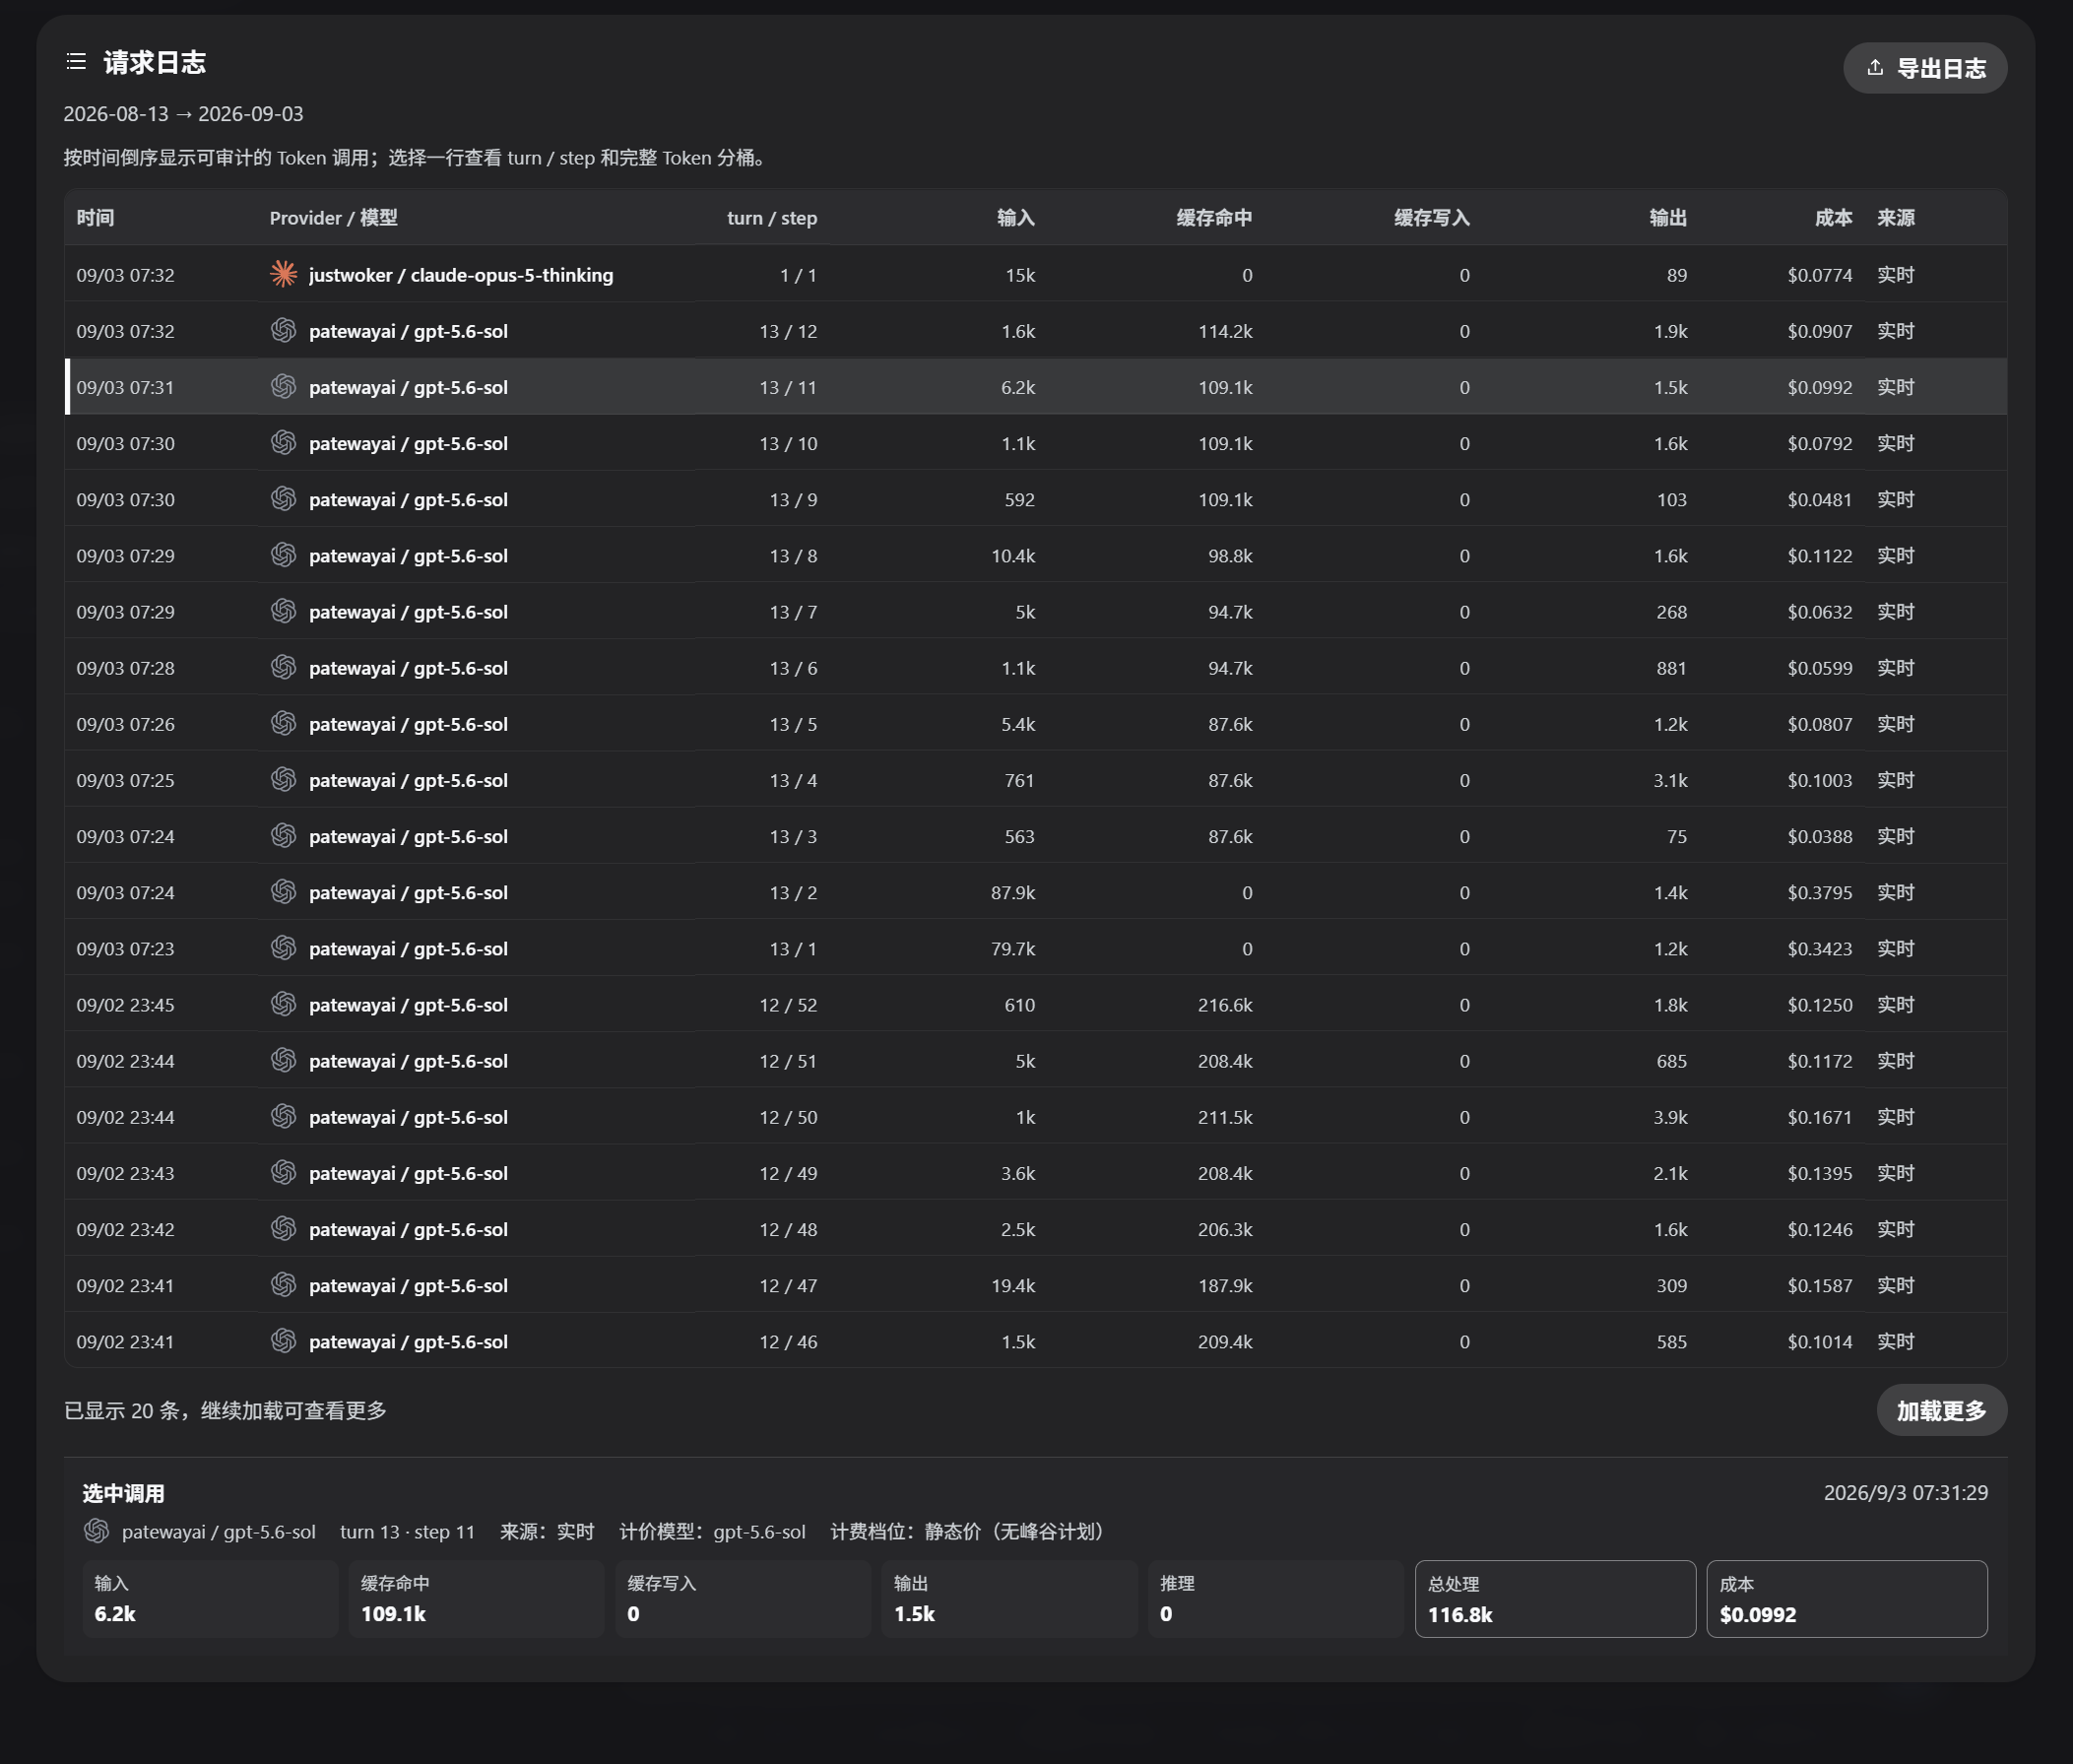
The analysis is granular. Three independent filter axes—model, provider, workspace—can be combined freely. Tokens are split into input, output, cache-read, cache-write, and reasoning buckets; costs follow the models.dev USD-per-1M catalogue with a four-bucket formula that clearly separates priced, free, and unpriced calls. A 53-week heatmap gives the big-picture rhythm, a trend line chart drills into hourly detail for a single day or daily aggregation across a range, with hover for exact values and click-through to that day's records. Account balance, usage streaks, and CSV export round out the picture. The interface switches between Chinese and English, and your choice sticks in the browser.
Under the hood the plugin is deliberately careful about performance. A durable per-session ledger enables incremental backfill: sessions whose logs have not changed are served straight from the ledger on restart without re-reading events, and the browser polls only a lightweight revision, fetching full data only when usage, aliases, or sync state actually change. That keeps multi-workspace, long-history setups fast on both reload and live refresh.
Who is it for? If you run several models or providers through DSH and want a clear answer to where the spend goes, whether caching is paying off, or if you just need a clean, exportable usage report for the team, this plugin fits right into the workflow as the missing dashboard layer.
截图预览
使用场景
- 查看每日 Token 消耗与 53 周热力图
- 按模型、供应商、工作区对比缓存命中率
- 导出团队用量报告供财务核算
适合人员
- 多模型、多供应商的 DSH 重度用户
- 需要向团队交代用量成本的工程师
- 关心缓存是否真正节省 Token 的开发者
相关插件
DSH 服务化侧边栏框架,提供文件工作台、内嵌浏览器、真实终端、Git 面板等完整工作台,并开放服务供插件扩展。

美观实用的 Claude Code 风格 TUI 插件:像素鲸鱼顶栏、流光大字、实时状态行、思考流式展开、时间回溯、上下文进度条与 TPS 仪表,零核心改动。

DeepSeek Harness 插件市场:浏览/搜索/一键安装社区插件与主题,支持更新、备份、热禁用、诊断与AI修复。

DSH Web 界面右下角常驻小鲸鱼余额挂件,自动显示 DeepSeek 余额、今日已用与每轮对话消耗,支持拖拽吸附与音效。