deepseek-harness-token
在终端中运行以下命令:
dsh plugin install zoyluoblue/deepseek-harness-token
将以下提示词粘贴到 DeepSeek Harness 对话框中:
在终端执行 dsh plugin install zoyluoblue/deepseek-harness-token 即可安装,源码见 https://github.com/zoyluoblue/deepseek-harness-token。
插件介绍
You have probably hit the same wall while running DeepSeek Harness: how many tokens did I actually burn, in total, across every home, every model, every day on this machine? deepseek-harness-token answers that question. It folds the session logs under ~/.dsh and every ~/.dsh_desktop into a single Token page inside Settings — no network calls, no model-facing tool registration, no session-event writes, and zero additional cost to the conversation itself.
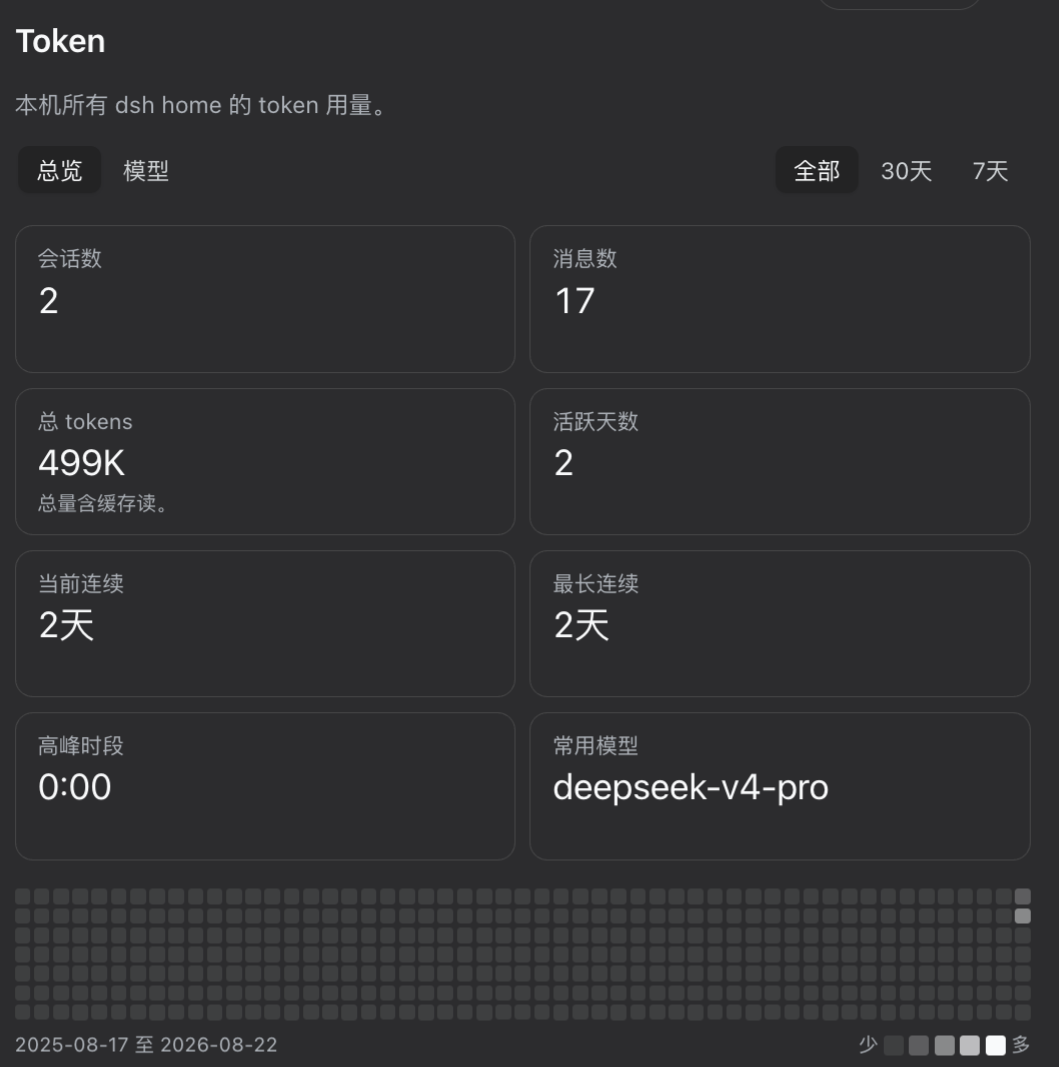
The page leads with headline figures: total tokens, session count, message count, active days, current and longest streak, peak hour, and your most-used model. Below that sits a 53-week, GitHub-style contribution heatmap (a day strip appears when you switch to a 7-day or 30-day window), then a per-model view that splits each model's usage into four disjoint buckets — input, cache read, cache write, and output — so a total dominated by cache reads is visible as such rather than hidden in a grand sum. All day and hour calculations use your local calendar via Intl, meaning a daylight-saving shift will not break a streak. Scanning happens incrementally in the background; the browser side never touches a log byte, only fetching a single loopback JSON response.
It deliberately does not report cost: the harness stores no price table, and any currency figure would be a local guess dressed up as a fact — use dsh-billing for balance and billing questions. It also does not target Electron desktop shells, whose module-resolution pinning can make a profile-installed plugin unresolvable and prevent the app from starting; sessions logged under ~/.dsh_desktop are still fully readable from dsh web, so one entry point is enough. This plugin is for developers who work in harness daily, want a global token rhythm at a glance, and would rather not open yet another browser tab to ask a usage question.
截图预览
使用场景
- 在 Settings 中快速查看整机 token 总量、会话数与 53 周贡献热力图
- 按模型拆分 input、cache read、cache write、output 四类 token 消耗占比
- 追踪连续使用天数、峰值时段及最常用模型,掌握自己的 token 节奏
适合人员
- 日常在 DeepSeek Harness 中写作的开发者,想随时掌握全局 token 消耗
- 关注缓存读写占比、希望四类 token 分布透明可见的用户
- 不想再开浏览器标签或跑脚本就能回答 token 问题的用户
相关插件
DSH 服务化侧边栏框架,提供文件工作台、内嵌浏览器、真实终端、Git 面板等完整工作台,并开放服务供插件扩展。

美观实用的 Claude Code 风格 TUI 插件:像素鲸鱼顶栏、流光大字、实时状态行、思考流式展开、时间回溯、上下文进度条与 TPS 仪表,零核心改动。

DeepSeek Harness 插件市场:浏览/搜索/一键安装社区插件与主题,支持更新、备份、热禁用、诊断与AI修复。

DSH Web 界面右下角常驻小鲸鱼余额挂件,自动显示 DeepSeek 余额、今日已用与每轮对话消耗,支持拖拽吸附与音效。