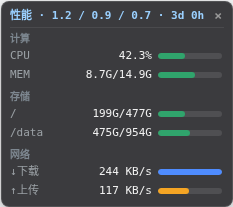
dsh-sysmon
在终端中运行以下命令:
dsh plugin install 21hbguo/dsh-sysmon
将以下提示词粘贴到 DeepSeek Harness 对话框中:
运行 dsh plugin install 21hbguo/dsh-sysmon 即可在 DeepSeek Harness 中安装该插件,项目仓库为 https://github.com/21hbguo/dsh-sysmon
插件介绍
You are deep in a DSH session, prompts flowing, models spinning. You want a casual glance at whether host CPU, memory, or network is spiking but you do not want to alt-tab to a terminal and run htop, and you certainly do not want to wire up a React monitoring widget on top of the Web GUI. dsh-sysmon fills exactly that gap: a small floating panel in the bottom-right corner that appears the moment you refresh the page, built with zero front-end frameworks on the client side and zero third-party dependencies on the host (just /proc reads and node:os). It polls the same-origin snapshot endpoint every two seconds, pauses automatically when the tab is hidden, and caches snapshots on the host so repeated polls do not re-read /proc. The total footprint is negligible.
The panel covers the metrics that matter day to day: CPU, memory, and disk (multiple physical mount points, root first) each with a progress bar; network download and upload shown on separate rows with auto-scaled bars based on recent peaks. Hovering either network row reveals a per-process TOP 10 overlay, sorted by byte rate when ss provides counters, or gracefully falling back to active connection count when it does not. For GPU, AMD is read directly from sysfs with zero child processes, while NVIDIA samples via nvidia-smi in a non-blocking background loop. The widget is draggable, collapsible to a single line, and hideable with a summon button; position persists in localStorage across refreshes.
It is aimed at developers and operators who are already living inside a DeepSeek Harness process. Linux gives you the full feature set (total network rate, process TOP 10, process count all lean on /proc or ss); non-Linux platforms still get CPU, memory, disk, load, uptime, and GPU, with network and process rows silently degrading to empty rather than breaking anything.
截图预览
使用场景
- 在 DSH Web GUI 中同时观察 CPU、内存、磁盘和网络负载
- 排查网络吞吐异常时查看进程级下载/上传 TOP10
- 本地运行 DSH 时低成本查看 AMD/NVIDIA GPU 使用率
- 在长会话中折叠或拖动悬浮窗以免遮挡工作区
适合人员
- 日常使用 DeepSeek Harness 的开发者
- 需要轻量级主机负载可见性的运维人员
- 希望避免额外监控框架的本地 DSH 用户
相关插件
DSH 服务化侧边栏框架,提供文件工作台、内嵌浏览器、真实终端、Git 面板等完整工作台,并开放服务供插件扩展。

美观实用的 Claude Code 风格 TUI 插件:像素鲸鱼顶栏、流光大字、实时状态行、思考流式展开、时间回溯、上下文进度条与 TPS 仪表,零核心改动。

DeepSeek Harness 插件市场:浏览/搜索/一键安装社区插件与主题,支持更新、备份、热禁用、诊断与AI修复。

DSH Web 界面右下角常驻小鲸鱼余额挂件,自动显示 DeepSeek 余额、今日已用与每轮对话消耗,支持拖拽吸附与音效。