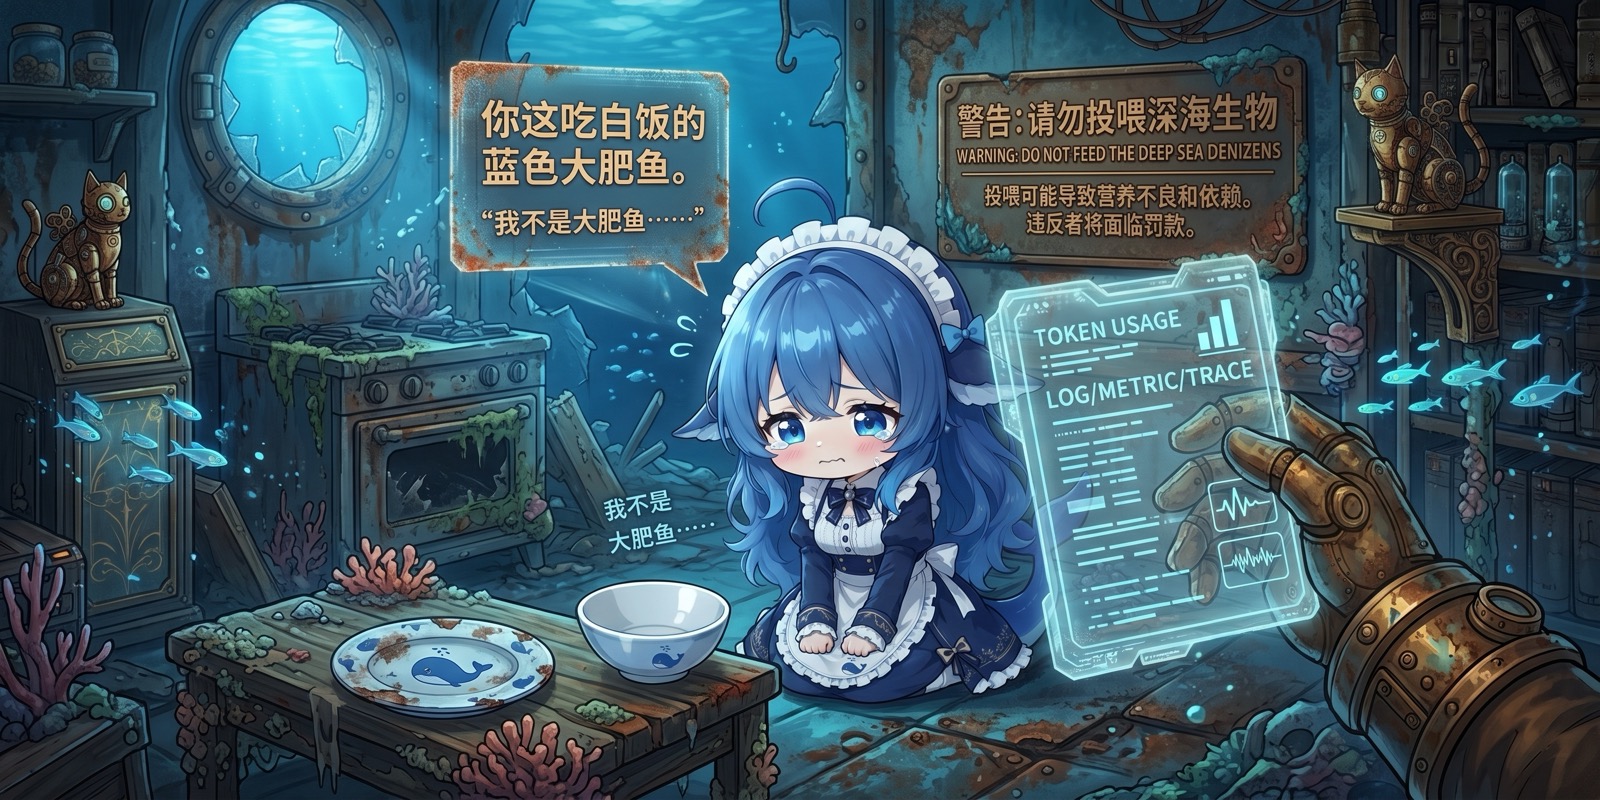
dsh-o11y-plugin
在终端中运行以下命令:
dsh plugin install fly3366/dsh-o11y-plugin
将以下提示词粘贴到 DeepSeek Harness 对话框中:
在 DeepSeek Harness 中执行 dsh plugin install fly3366/dsh-o11y-plugin 即可安装,完整源码地址:https://github.com/fly3366/dsh-o11y-plugin
插件介绍
DeepSeek Harness ships built-in session-level OpenTelemetry telemetry but exposes no plugin-scoped metric or log pipeline to third-party plugins. The result is that every plugin wanting standard, consistent observability had to wire up its own providers, exporters, and configuration—a repetitive and error-prone task. dsh-o11y-plugin closes that gap in a single, drop-in step.
On startup the plugin registers global OpenTelemetry providers once. From that point on, any plugin that calls trace.getTracer(), metrics.getMeter(), or logs.getLogger() from @opentelemetry/api automatically exports traces, metrics, and logs through one consistently configured pipeline. It also bridges dsh session telemetry into the OTel log stream so platform-level and plugin-level data share a single timeline. Every knob—service name, OTLP/HTTP endpoint, per-signal toggles, metric export interval—is surfaced under the o11y namespace in the dsh Web settings UI for easy inspection and tuning.
It is built for dsh plugin authors who want community-compatible, standardized observability without re-implementing OTel plumbing per plugin. The plugin is stateless, writes no files, reads no credentials, and buffers telemetry in memory until the OTLP endpoint is reachable; if no collector answers, batches are dropped silently with no side effects. It is implemented on the official OpenTelemetry Node.js SDK, the same dependency family dsh uses for its own session telemetry, ensuring upstream and downstream compatibility out of the box.
截图预览
使用场景
- 为 dsh 插件统一导出链路追踪、指标与日志
- 将平台 session 遥测桥接为 OTel 日志流
- 通过 Web 设置面板集中管理遥测导出配置
适合人员
- 需要标准可观测性但不想重复搭建 OTel 的 dsh 插件开发者
- 希望插件遥测与平台会话遥测共享同一时间线的团队
- 追求社区兼容的 OpenTelemetry 导出方案的构建者
相关插件
集运行时热注入、任务感知模式路由与会话级分级协议于一体,实现免重启装配、P1-P23实测路由及红队门审计,保障长程推理勤勉度。
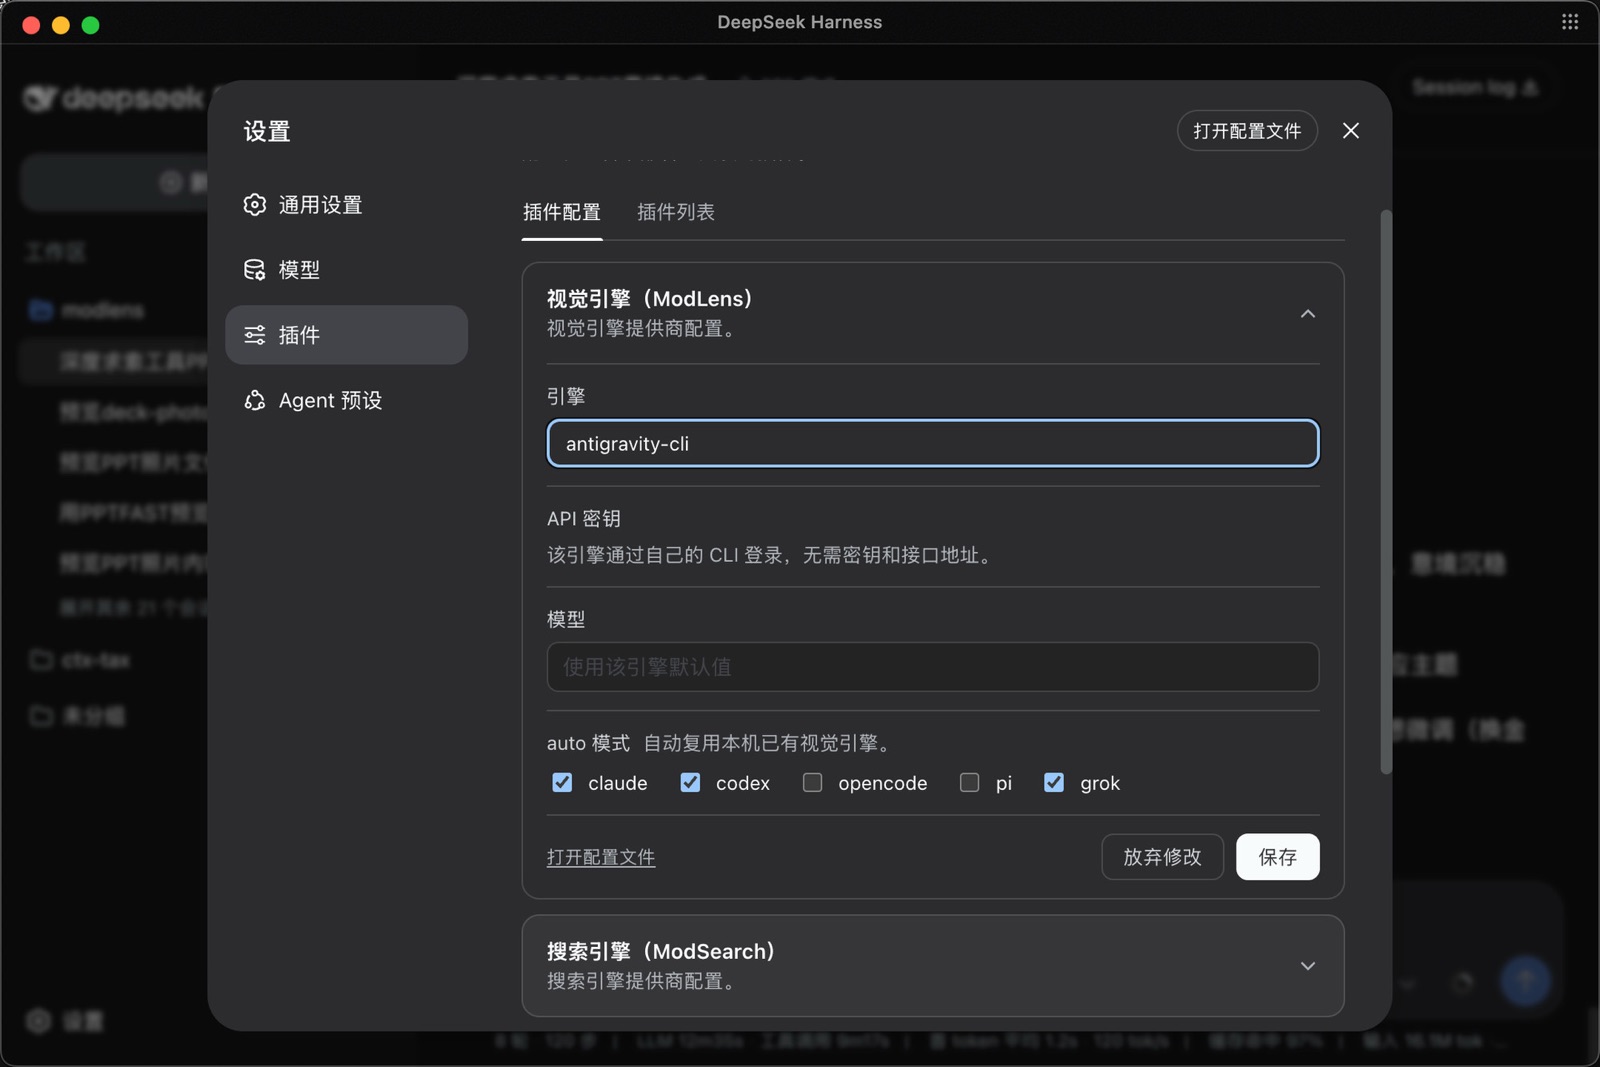
ModLens 是 DeepSeek Harness 的视觉插件,让纯文本模型直接读取聊天中粘贴的图片,无需保存文件或传路径,零配置并支持多引擎。
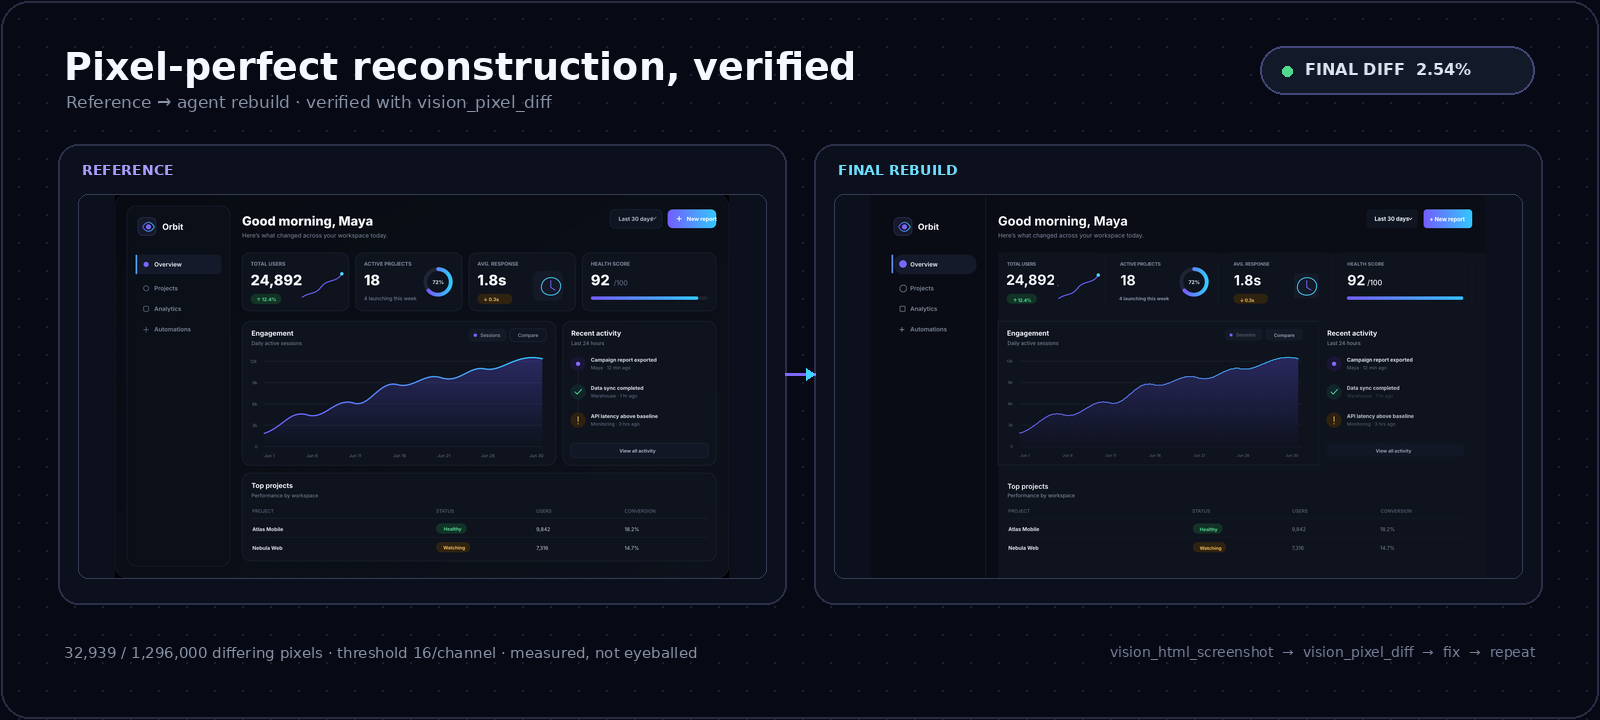
为DeepSeek Harness文本代理提供按需视觉能力:内置免费无密钥视觉链与14个视觉工具,图像作为工具调用路由到视觉模型,像素保真,无需Python,一键安装。
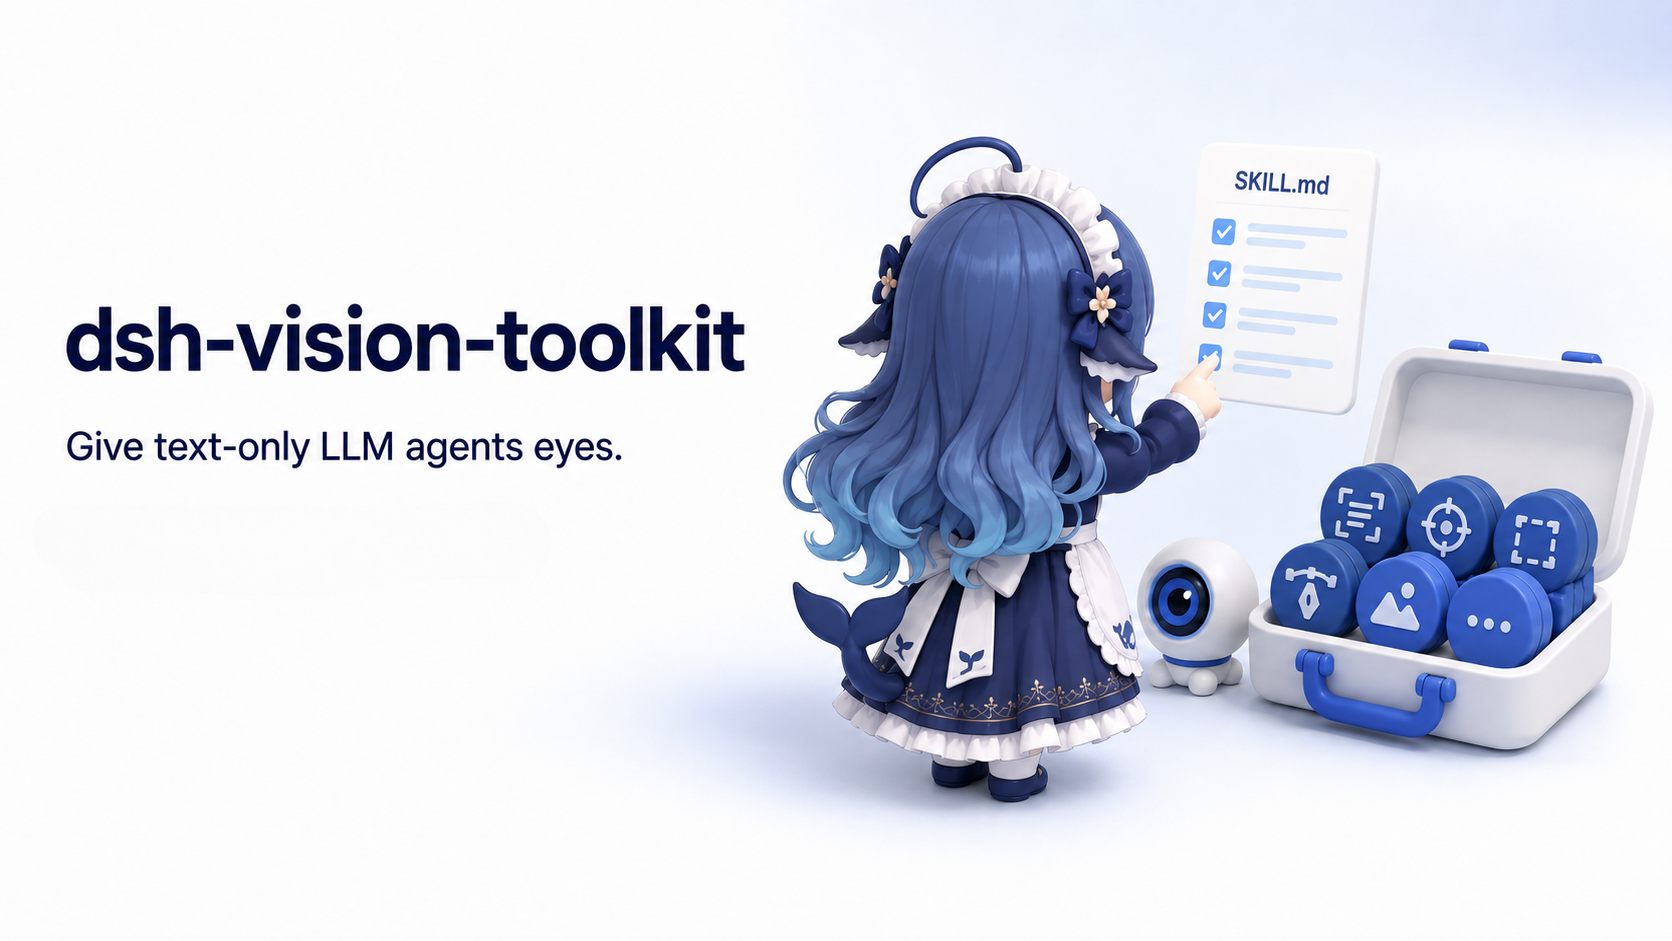
为 DeepSeek Harness 文本模型赋予视觉能力,支持图像问答、长截图 OCR、UI 重建与 GUI 视觉任务。